Page 171 - index
P. 171

169

                                                                                                                                     StarHub Ltd Annual Report 2015

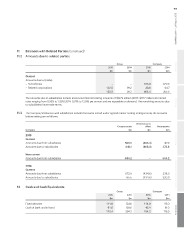
11	 Balances with Related Parties (continued)
11.2	 Amounts due to related parties

                                                        Group                        Company                                         Overview
                                                                            2015
                                               2015            2014                             2014
                                                 $m              $m           $m                  $m

Current                                              –             –        373.8               320.9
Amounts due to (trade):                        122.5           99.2          30.6                 64.7
–	Subsidiaries                                 122.5           99.2
–	 Related corporations                                                     404.4               385.6

	 The amounts due to subsidiaries include unsecured interest bearing amounts of $167.9 million (2014: $111.7 million) at interest    Strategy
          rates ranging from 0.93% to 1.25% (2014: 0.91% to 1.20%) per annum and are repayable on demand. The remaining amounts due
          to subsidiaries have trade terms.

11.3	 The Company’s balances with subsidiaries included amounts netted under agreed master netting arrangements; the amounts

          before netting are as follows:

Company                                                 Gross amounts       Gross amounts       Net amounts
                                                                        $m              offset               $m
2015
Current                                                                                     $m
Amounts due from subsidiaries
Amounts due to subsidiaries                                    565.5        (468.3)               97.2                               Performance
                                                               842.1        (468.3)             373.8

Non-current                                                    344.2        – 344.2
Amounts due from subsidiaries

2014                                                           672.9        (434.6)             238.3                                Governance & Sustainability
Current                                                        755.5        (434.6)             320.9
Amounts due from subsidiaries
Amounts due to subsidiaries

12	 Cash and Cash Equivalents                           Group                        Company
                                                                            2015
          Fixed deposits                       2015            2014                             2014
          Cash at bank and in hand               $m              $m           $m                  $m

                                               111.8           124.6        111.8               95.0                                 Financials
                                                61.6           139.6         42.4                81.0
                                                               264.2                            176.0
                                               173.4                        154.2
   166   167   168   169   170   171   172   173   174   175   176