Page 6 - Annual Report 2014
P. 6

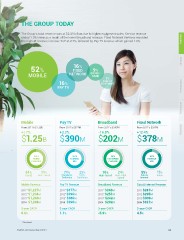
The Group Today                                                                                                       Overview

The Group’s total revenue was at $2.39 billion due to higher equipment sales. Service revenue
ended 1.0% lower as a result of the lower Broadband revenue. Fixed Network Services recorded
the highest revenue increase YoY at 2.7%, followed by Pay TV revenue which gained 1.0%.

                                          16%                                                                         Strategy

52%                                           fixed       9%
                                           network        broad-
Mobile                                                    band
                                  16%                             7%
                                                                  sale of                                             Performance
                                  Pay tv                          equipment

                                                                                                                      Governance

Mobile                            Pay TV                  Broadband                      Fixed Network                Financials

From 2011’s $1.23B                From 2011’s $377M       From 2011’s $243M              From 2011’s $337M

+1.7%                             +3.2%                   -16.8%                         +12.4%

$1.25B                            $390M                   $202M                          $378M

   2014                              2014                                   2014            2014
 tiered                           channel                              high speed        Revenue
plan Mix                                                                plan Mix
                                      Mix                                                   Mix
                                                             76% 24%
61%       39%                      71%         29%                                       85%       15%
                                                           High-Speed Non-High
Tiered  Non-Tiered                Standard-     High-                             Speed  Data &    Voice
                                  Definition  Definition                                 Internet
                                                          Broadband Revenue
Mobile Revenue                    Pay TV Revenue                                         Data & Internet Revenue
                                                          2011^ $243M
2011^ $1,227M                     2011^ $377M             2012^ $251M                    2011 $281M
2012^ $1,234M                     2012^ $396M             2013^ $242M                    2012 $295M
2013^ $1,243M                     2013^ $386M             2014 $202M	                    2013 $303M
2014 $1,248M                      2014 $390M	                                            2014 $321M	
                                                          3-year CAGR
3-year CAGR                       3-year CAGR                                            3-year CAGR
                                                          -5.9%
0.6%                              1.1%                                                   4.5%

      ^ Restated                                                                                                  03
StarHub Ltd | Annual Report 2014
   1   2   3   4   5   6   7   8   9   10   11