Page 7 - Annual Report 2014
P. 7

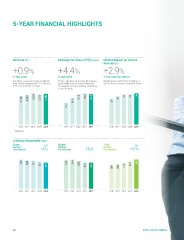
5-Year Financial Highlights

Revenue ($m)                               Earnings Per Share (EPS) (cents)           EBITDA Margin on Service
                                                                                      Revenue (%)
+0.9%                                      +4.4%
                                                                                      +2.9%
3-Year CAGR                                3-Year CAGR
The higher equipment sales resulted in     EPS is calculated by dividing the Group’s  3-Year CAGR on EBITDA
total revenue increasing $17.6 million or  profit attributable to equity holders by
0.7% YoY to $2,387.2 million.              the weighted average number of ordinary    EBITDA amounted to $747.9 million or
                                           shares in issue.                           33.7% of service revenue for the full year.

2,238
       2,323

               2,434
                       2,370
                               2,387
                                                        15.3
                                                                18.8
                                                                        21.4

                                                                                22.0
                                                                                       21.4
                                                                                                                 28
                                                                                                                         31

                                                                                                                                 33
                                                                                                                                        33
                                                                                                                                                34

          2010 2011^ 2012^ 2013^ 2014      2010 2011^ 2012^ 2013^ 2014                2010 2011^ 2012^ 2013^ 2014
^	Restated

Hubbing Households (‘000)

Single           YoY                       Double      Flat                           Triple            YoY
Service                                    Service                                    Service
Households  -4%                            Households                                 Households  +6%

350
       342
               337
                       327
                               313
                                                        240
                                                                244
                                                                        232
                                                                                219
                                                                                       219
                                                                                                                 200
                                                                                                                         205
                                                                                                                                 214
                                                                                                                                        227
                                                                                                                                                242

2010 2011 2012 2013 2014                   2010 2011 2012 2013 2014                   2010 2011 2012 2013 2014

04 many lives of hubbing
   2   3   4   5   6   7   8   9   10   11   12