
Page 179 - index
P. 179
177
StarHub Ltd Annual Report 2015
20 Operating Expenses (continued) Overview
20.2.2 Share-based Payments (continued)
StarHub Performance Share Plans (continued)
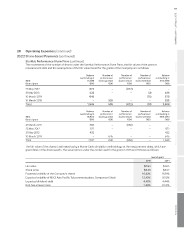
The movements of the number of shares under the StarHub Performance Share Plans, the fair values of the grant at
measurement date and the assumptions of the fair value model for the grants of the Company are as follows:
2015 Balance Number of Number of Number of Balance
Date of grant outstanding at performance performance performance outstanding at
shares granted shares vested shares forfeited
25 May 2012 1.1.2015 31.12.2015
31 May 2013 ’000 ’000 ’000 ’000 ’000
10 March 2014
16 March 2015 872 – (872) – – Strategy
Total 432 – – (3) 429
645 – – (75) 570
535 – – 535
– 535 (78) 1,534
1,949 (872)
2014 Balance Number of Number of Number of Balance
Date of grant outstanding at performance performance performance outstanding at
shares granted shares vested shares forfeited
31 March 2011 1.1.2014 31.12.2014
25 May 2012 ’000 ’000 ’000 ’000 ’000
31 May 2013
10 March 2014 858 – (858) – – Performance
Total 872 – – – 872
432 – – – 432
645 – – 645
– 645 – 1,949
2,162 (858)
The fair value of the shares is estimated using a Monte-Carlo simulation methodology at the measurement dates, which are
grant dates of the share awards. The assumptions under the model used for the grant in 2015 and 2014 are as follows:
Year of grant
2015 2014 Governance & Sustainability
Fair value $2.94 $2.65
Share price $4.25 $4.07
Expected volatility of the Company’s shares 16.23% 16.91%
Expected volatility of MSCI Asia-Pacific Telecommunications Component Stock 12.42% 9.50%
Expected dividend yield 4.48% 4.44%
Risk-free interest rates 1.39% 0.50%
Financials