Page 181 - index
P. 181

179

                                                                                                                              StarHub Ltd Annual Report 2015

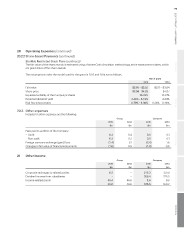
20	 Operating Expenses (continued)                                                                                            Overview

20.2.2	Share-based Payments (continued)

	 StarHub Restricted Stock Plans (continued)
	 The fair value of the share awards is estimated using a Monte-Carlo simulation methodology at the measurement dates, which

          are grant dates of the share awards.

	 The assumptions under the model used for the grant in 2015 and 2014 are as follows:                Year of grant  2014
                                                                                              2015
          Fair value
          Share price                                                                   $3.65 – $3.82     $3.11 – $3.84       Strategy
          Expected volatility of the Company’s shares                                   $3.98 – $4.25               $4.07
          Expected dividend yield                                                                                  16.91%
          Risk-free interest rates                                                              16.23%             4.44%
                                                                                       4.48% – 5.15%
                                                                                       0.70% – 1.36%    0.26% – 0.46%

20.3	 Other expenses                                             Group                                 Company
                                                                                              2015
	 Included in other expenses are the following:           2015                         2014                         2014
                                                            $m                           $m     $m                    $m
          Fees paid to auditors of the Company:
          –	Audit                                         0.4                          0.4    0.1                   0.1       Performance
          –	Non-audit                                     0.3                          0.2    0.1                   0.1
          Foreign currency exchange (gain)/ loss          (1.4)                        3.1    (2.4)                 1.8
          Changes in fair value of financial instruments  (1.0)                        0.9    (1.0)                 0.9

21	 Other Income                                                 Group                                 Company                Governance & Sustainability
                                                                                              2015
          Corporate recharges to related parties          2015                         2014                         2014
          Dividend income from subsidiaries                 $m                           $m     $m                    $m
          Income related grants
                                                           0.2                             –  215.2                 231.4
                                                              –                            –  309.4                 326.5
                                                                                       46.6
                                                          45.4                         46.6      1.9                   0.3
                                                          45.6                                526.5                 558.2

                                                                                                                              Financials
   176   177   178   179   180   181   182   183   184   185   186