
Page 189 - index
P. 189
187
StarHub Ltd Annual Report 2015
29 Financial Risk Management (continued)
Liquidity risk (continued)
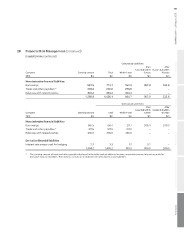
Contractual cash flows Overview
After After
1 year but within 5 years but within
Company Carrying amount Total Within 1 year 5 years 10 years
2015 $m $m
$m $m $m
Non-derivative financial liabilities 687.5
Borrowings 278.0 773.7 152.3 387.8 233.6
Trade and other payables ^ 404.4 278.0 278.0 – –
Balances with related parties 1,369.9 404.4 404.4 – –
1,456.1 834.7
387.8 233.6
Contractual cash flows Strategy
After After
1 year but within 5 years but within
Company Carrying amount Total Within 1 year 5 years 10 years
2014 $m $m
$m $m $m
Non-derivative financial liabilities 687.5
Borrowings 317.9 758.4 211.7 306.4 240.3 Performance
Trade and other payables ^ 385.6 317.9 317.9 – –
Balances with related parties 385.6 385.6 – –
Derivative financial liabilities 3.3 3.3 3.1 0.2 –
Interest rate swaps used for hedging 1,394.3 1,465.2 918.3 306.6 240.3
^ The carrying amount of trade and other payables disclosed in the table exclude deferred income, unearned revenue, interest accruals for
derivative financial liabilities. The interest accruals are included in the derivative financial liabilities.
Governance & Sustainability
Financials