Page 186 - index
P. 186

184

  NOTES TO THE
  FINANCIAL STATEMENTS

       YEAR ENDED 31 DECEMBER 2015

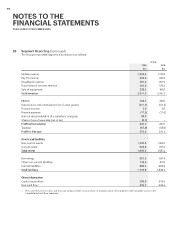
28	 Segment Reporting (continued)

	 The Group’s reportable segment information is as follows:

                                                                       Group

                                                             2015                                                                           2014
                                                               $m                                                                             $m

Mobile revenue                                               1,239.8                                                                        1,247.6
Pay TV revenue                                                 391.0                                                                          389.7
Broadband revenue                                              200.3                                                                          201.9
Fixed network services revenue                                 384.9                                                                          378.3
Sale of equipment                                              228.3                                                                          169.7
Total revenue                                                                                                                               2,387.2
                                                             2,444.3

EBITDA                                                       712.7                                                                          747.9
Depreciation and amortisation (net of asset grants)          (271.4)                                                                        (271.2)
Finance income
Finance expense                                                  2.0                                                                           2.0
Gain on deconsolidation of a subsidiary company               (17.8)                                                                        (22.6)
Share of loss of associate (net of tax)                        15.0
Profit before taxation                                                                                                                           –
Taxation                                                        (0.3)                                                                            –
Profit for the year                                          440.2                                                                          456.1
                                                              (67.9)                                                                        (85.6)
                                                             372.3                                                                          370.5

Assets and liabilities                                       1,305.6                                                                        1,315.6
Non-current assets                                             603.8                                                                          671.6
Current assets
Total assets                                                 1,909.4                                                                        1,987.2

Borrowings                                                     687.5                                                                          687.5
Other non-current liabilities                                  143.9                                                                          157.8
Current liabilities                                            890.4                                                                         992.9
Total liabilities                                            1,721.8                                                                        1,838.2

Other information                                            289.0                                                                          349.8
Capital expenditure                                          215.7                                                                          333.3
Free cash flow *

*	 Free cash flow refers to net cash from operating activities less purchase of property, plant and equipment and intangible assets in the
      consolidated cash flow statement.
   181   182   183   184   185   186   187   188   189   190   191