Page 5 - index
P. 5

THE                                          16%                9%                                          03   StarHub Ltd Annual Report 2015
GROUP                                      8%
TODAY                                                               FY2015             51%

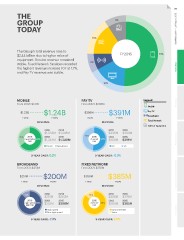
The Group’s total revenue rose to                                                                                Overview
$2.44 billion due to higher sales of
equipment. Service revenue remained
stable. Fixed Network Services recorded
the highest revenue increase YoY at 1.7%,
and Pay TV revenue was stable.

                                                       16%

MOBILE                                     PAY TV                                      Legend                    Strategy

From 2012’s $1.23B                         From 2012’s $396M                               	Mobile
                                                                                            	Pay TV
$1.23B       $1.24B                        $396M         $391M                              	Broadband
                                                                                           	 Fixed Network
   FY2012                         FY2015       FY2012                          FY2015      	 Sales of Equipment

           REVENUE:                                    REVENUE:

35% 2015                2012     2014      48% 2015             2012       2014                                  Performance
       tiered plan 65%                             channel 52%
            mix         $1,234M  $1,248M             mix        $396M      $390M

                        2013     2015                           2013       2015

                        $1,243M  $1,240M                        $386M      $391M

                        Tiered Non-tiered                           HD      SD

           3-YEAR CAGR: 0.2%                           3-YEAR CAGR: -0.5%

BROADBAND                                  FIXED NETWORK                                                         Governance & Sustainability

From 2012’s $251M                          From 2012’s $358M

$251M        $200M                         $358M         $385M

   FY2012                       FY2015       FY2012                         FY2015

           REVENUE:                                    REVENUE:

12%                     2012     2014      14%                  2012       2014                                  Financials

   2015                 $251M    $202M        2015              $358M      $378M
high speed 88%                              revenue 86%
                        2013     2015                           2013       2015
 plan mix                                      mix
                        $242M    $200M                          $368M      $385M

                        High speed                              Data & Internet
                        Non-high speed                          Voice

           3-YEAR CAGR: -7.3%                          3-YEAR CAGR: 2.5%
   1   2   3   4   5   6   7   8   9   10