
Page 6 - index
P. 6
04
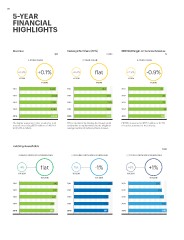
5-YEAR
FINANCIAL
HIGHLIGHTS
Revenue Earnings Per Share (EPS) EBITDA Margin on Service Revenue
$M cents %
3-YEAR CAGR
3-YEAR CAGR 3-YEAR CAGR
+0.9% +0.1% +4.4% flat +2.9% -0.9%
FY2014 FY2015 FY2014 FY2015 FY2014 FY2015
2,323 18.8 31
2011 2011 2011
2012 2,434 2012 21.4 2012 33
2013 2,370 2013 22.0 2013 33
2014 2,387 2014 21.4 2014 34
2015 2,444 2015 21.4 2015 32
The higher equipment sales resulted in total EPS is calculated by dividing the Group’s profit EBITDA amounted to $712.7 million or 32.2%
revenue increasing $57.1 million or 2.4% YoY attributable to equity holders by the weighted of service revenue for the full year.
to $2,444.3 million. average number of ordinary shares in issue.
Hubbing Households || DOUBLE SERVICE HOUSEHOLD ‘000
||| TRIPLE SERVICE HOUSEHOLD
| SINGLE SERVICE HOUSEHOLD
-4% flat flat -1% +6% +1%
YoY 2014 YoY 2015 YoY 2014 YoY 2015 YoY 2014 YoY 2015
205
2011 342 2011 244 2011 214
2012 2012 2012 227
2013 337 2013 232 2013 242
2014 2014 2014 245
2015 327 2015 219 2015
313 219
312 217