
Page 103 - index
P. 103
101
StarHub Ltd Annual Report 2015
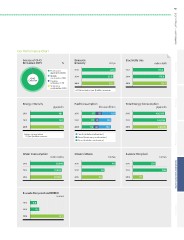
Our Performance Chart
Source of GHG % Emission Electricity Use million KWh Overview
Emissions 2015 Intensity tCO2e 115.2
Purchased 118.8
GHG electricity 96.59 2013 24.8 2013 121.7
Emission Mobile
combustion 1.00 2014 22.9 2014
Fugitive
emissions 2.21 2015 23.2 2015
Stationary
combustion 0.20 tCO2e emission per $million revenue
Energy Intensity Fuel Consumption Total Energy Consumption Strategy
gigajoules (thousand) litres gigajoules
2013 181 2013 127 55 129 2013 426,025
2014 183 2014 117 32 123 2014 437,466
2015 183 2015 113 42 114 2015 448,012
Energy consumption Petrol (mobile combustion) Performance
– GJ per $million revenue Diesel (stationary combustion)
Diesel (mobile combustion)
Water Consumption General Waste E-waste Recycled
cubic metres tonnes tonnes
2013 29,348 2013 49 2013 259 Governance & Sustainability
2014 27,832 2014 33 2014 385
2015 27,500 2015 30 2015 117
E-waste Recycled via RENEW
tonnes
2013 6.6
2014 8.7 Financials
2015 31.7