
Page 127 - index
P. 127
125
StarHub Ltd Annual Report 2015
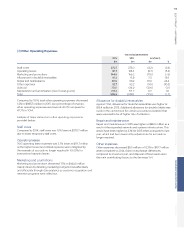
(ii) Other Operating Expenses
Year ended 31 December
2015 2014 Incr/(Decr)
$m
$m $m % Overview
Staff costs 270.7 275.0 (4.3) (1.6)
Operating leases 121.7 128.4 (6.7) (5.2)
Marketing and promotions 144.6 156.2 (11.6) (7.5)
Allowance for doubtful receivables 18.4 2.5 15.6
Repair and maintenance 86.0 15.9 16.8 24.4
Other expenses 82.7 69.2 (9.5) (10.3)
Subtotal 724.1 92.2 (12.8) (1.7)
Depreciation and amortisation (net of asset grants) 271.4 736.9 0.2 0.1
Total 995.5 271.2 (12.6) (1.2)
1,008.1
Compared to 2014, total other operating expenses decreased Allowance for doubtful receivables Strategy
1.2% to $995.5 million in 2015. As a percentage of revenue,
other operating expenses was lower at 40.7% compared to Against 2014, allowance for doubtful receivables was higher at Performance
42.2% in 2014. $18.4 million in 2015. Additional allowance for doubtful debts was
made in the current year for certain accounts receivables’ that
Analysis of major variances in other operating expenses is were assessed to be of higher risk of collection.
provided below:
Repair and maintenance
Staff costs
Repair and maintenance in 2015 was higher at $86.0 million as a
Compared to 2014, staff costs was 1.6% lower at $270.7 million result of the expanded network and systems infrastructure. This
due to lower temporary staff costs. would have been higher by 2.1% for 2015 when compared to last
year, which had been lowered by adjustments for accruals no
Operating leases longer required.
2015 operating lease expenses was 5.2% lower at $121.7 million Other expenses
as the higher leases and related expenses were mitigated by
the reversals of accruals no longer required in 1Q-2015 for Other expenses decreased $9.5 million or 10.3% to $82.7 million
international capacity leases. when compared to 2014. Gains on exchange differences,
compared to a loss last year; and disposal of fixed assets were
Marketing and promotions the main contributing factors to the decrease YoY.
Marketing and promotions decreased 7.5% to $144.6 million Governance & Sustainability
mainly driven by directing marketing budgets more effectively
and efficiently through data analytics as customer acquisition and
retention programs were rolled out.
Financials