Page 128 - index
P. 128

126

   GROUP
   FINANCIAL
   REVIEW

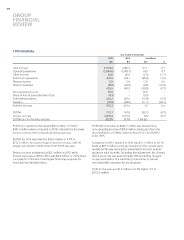
1.3 Profitability                                                               Year ended 31 December

Total revenue                                                             2015  2014                    Incr/(Decr)
Operating expenses                                                          $m
Other income                                                                    $m $m                                          %
Profit from operations                                             2,444.3
Finance income                                                     (2,048.6)    2,387.2    57.1                                  2.4
Finance expenses                                                                (1,957.1)   91.5                                 4.7
                                                                        45.6                 (1.0)                              (2.2)
Non-operating income                                                  441.3         46.6   (35.4)                               (7.5)
Share of loss of associate (net of tax)                                           476.7      0.0                                 3.0
Profit before taxation                                                   2.0                (4.8)                              (21.2)
Taxation                                                                (17.8)       2.0   (30.6)                               (6.7)
Profit for the year                                                   425.5        (22.6)   15.0
                                                                        15.0      456.1     (0.3)                                   –
EBITDA                                                                   (0.3)             (15.9)                                   –
Service revenue                                                       440.2             –  (17.7)                               (3.5)
EBITDA as a % of service revenue                                       (67.9)           –                                      (20.7)
                                                                      372.3       456.1       1.8                                0.5
Profit from operations decreased $35.4 million or 7.5% to                          (85.6)
$441.3 million when compared to 2014, impacted by the lower                       370.5
service revenue and increased operating expenses.
                                                                    712.7        747.9          (35.2)                         (4.7)
EBITDA for 2015 was lower by $35.2 million or 4.7% to              2,216.0      2,217.5           (1.5)                        (0.1)
$712.7 million. As a percentage of service revenue, EBITDA          32.2%        33.7%
margin was 32.2% in 2015, down from 33.7% last year.                                       -1.6% pts

Finance income maintained at $2.0 million in 2015, while           Profit before taxation at $440.2 million was boosted by a
finance expenses at $17.8 million was $4.8 million or 21.2% lower  non-operating income of $15.0 million, being gain from the
compared to 2014 which had higher financing expenses for           deconsolidation of SHINE Systems Assets Pte. Ltd. (SSAPL)
new bank loan facilities taken.                                    in 3Q-2015.	

                                                                   Compared to 2014, taxation in 2015 was $17.7 million or 20.7%
                                                                   lower at $67.9 million as the tax expense for the current year’s
                                                                   taxable profits was reduced by adjustments for prior periods’
                                                                   group tax relief benefits. Excluding this adjustment, the Group’s
                                                                   effective tax rate was approximately 18% (excluding the gain
                                                                   on deconsolidation of a subsidiary), due mainly to certain
                                                                   non-deductible expenses for tax purposes.

                                                                   Profit for the year was $1.8 million or 0.5% higher YoY at
                                                                   $372.3 million.
   123   124   125   126   127   128   129   130   131   132   133