
Page 129 - index
P. 129
127
StarHub Ltd Annual Report 2015
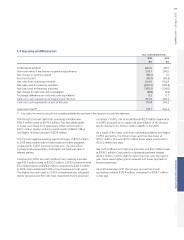
1.4 Liquidity and Resources
Year ended 31 December
2015 2014
$m $m Overview
Profit before taxation 440.2 456.1 Strategy
Non-cash items & net finance expenses adjustments 233.7 256.0
Net change in working capital (36.7)
Income tax paid (92.7) 8.1
Net cash from operating activities 544.5 (65.3)
Net cash used in investing activities (300.3) 654.9
Net cash used in financing activities (335.3) (318.8)
Net change in cash and cash equivalents (339.0)
Exchange difference on cash and cash equivalents (91.1)
Cash and cash equivalents at beginning of the year 0.3 (2.9)
Cash and cash equivalents at end of the year 264.2 0.2
173.4 266.9
264.2
Free Cash Flow (1) 215.7 333.3
(1) Free Cash Flow refers to net cash from operating activities less purchase of fixed assets in the cash flow statement.
The Group’s total net cash from operating activities was company – SSAPL, net of an additional $12.0 million investment Performance
$110.4 million lower at $544.5 million. This was attributable in SSAPL pursuant to an equity call post dilution of the Group’s
to lower cash flows from operations which accounted for equity interest from 100% to 30% in SSAPL in 3Q-2015. Governance & Sustainability
$38.2 million, higher working capital needs of $44.8 million
and higher income tax paid of $27.4 million. As a result of the lower cash from operating activities and higher
CAPEX payments, the Group’s free cash flow was lower at
The Group’s negative working capital changes of $36.7 million $215.7 million. This was $117.6 million lower when compared to
in 2015 were mainly due to lower trade and other payables, $333.3 million last year.
coupled with higher inventories balances. This was offset
by lower trade receivables, and higher net balances due to Net cash outflow from financing activities was $3.7 million lower
related parties. at $335.3 million. Cash used for dividends payment totaled
$345.9 million in 2015, slightly higher than last year. During the
Compared to 2014, net cash outflow from investing activities year, there were higher grants received and lower payment of
was $18.5 million lower at $300.3 million. CAPEX payments were finance expenses.
$7.2 million higher at $328.8 million compared to $321.6 million
in 2014, and represented 13.5% of total revenue in both years. As at 31 December 2015, the Group’s net cash and cash
The higher net cash used in CAPEX investments was mitigated equivalents totaled $173.4 million, compared to $264.2 million
by the net proceeds from the loan repayment by the associate a year ago.
Financials