
Page 126 - index
P. 126
124
GROUP
FINANCIAL
REVIEW
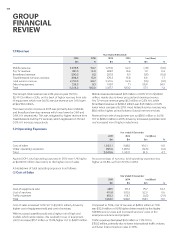
1.1 Revenue
Year ended 31 December
2015 2015 2014 2014 Incr/(Decr)
$m % $m
$m % %
Mobile revenue 1,239.8 50.7 1,247.6 52.3 (7.8) (0.6)
Pay TV revenue 391.0 16.0 389.7 16.3 1.3 0.3
Broadband revenue 200.3 8.2 201.9 8.5 (1.6) (0.8)
Fixed Network Services revenue 384.9 15.8 378.3 15.8 6.6 1.7
Total service revenue 90.7 2,217.5 92.9 (1.5) (0.1)
Sale of equipment 2,216.0 9.3 169.7 58.6 34.5
Total 228.3 100.0 2,387.2 7.1 57.1 2.4
100.0
2,444.3
The Group’s total revenue rose 2.4% year-on-year (YoY) to Mobile revenue decreased $7.8 million or 0.6% YoY to $1,239.8
$2,444.3 million in 2015, on the back of higher revenue from sale million, mainly due to lower pre-paid and roaming revenue.
of equipment which rose 34.5%; service revenue was 0.1% lower Pay TV service revenue grew $1.3 million or 0.3% YoY, while
at $2,216.0 million. Broadband revenue at $200.3 million was $1.6 million or 0.8%
lower when compared to 2014. Fixed Network service revenue was
The lower service revenue in 2015 was primarily due to Mobile $6.6 million higher, primarily due to Data & Internet services.
and Broadband services revenue which was lower by 0.6% and
0.8% YoY respectively. This was mitigated by higher revenue from Revenue from sale of equipment was up $58.6 million or 34.5%
Fixed Network and Pay TV services, which registered a 1.7% and YoY to $228.3 million in 2015, driven by increased quantities sold
0.3% YoY increase respectively. and increased mix of higher end phones.
1.2 Operating Expenses
Year ended 31 December
2015 2014 Incr/(Decr)
$m
$m $m %
Cost of sales 1,053.1 949.0 104.1 11.0
Other operating expenses 995.5 1,008.1 (12.6) (1.2)
Total 1,957.1 91.5 4.7
2,048.6
Against 2014, total operating expenses in 2015 was 4.7% higher As a percentage of revenue, total operating expenses was
at $2,048.6 million due mainly to the higher cost of sales. higher at 83.8%, up from 82.0% in 2014.
A breakdown of total operating expenses is as follows:
(i) Cost of Sales
Year ended 31 December
2015 2014 Incr/(Decr)
$m
$m $m %
Cost of equipment sold 487.1 411.4 75.7 18.4
Cost of services 415.8 382.9 32.9 8.6
Traffic expenses 150.2 154.7 (4.5) (2.9)
Total 1,053.1 949.0 104.1 11.0
Cost of sales increased 11.0% YoY to $1,053.1 million, driven by Compared to 2014, cost of services at $415.8 million in 2015
higher cost of equipment sold and cost of services. was $32.9 million or 8.6% higher driven mainly by the higher
NGNBN service costs and increased services’ costs of the
With increased quantities sold and a higher mix of high end enterprise solutions and projects.
models which were costlier, this resulted in cost of equipment
sold to increase $75.7 million or 18.4% higher YoY to $487.1 million. Traffic expenses decreased $4.5 million or 2.9% YoY to
$150.2 million, primarily due to lower international traffic volume
and lower interconnection rates in 2015.