
Page 130 - index
P. 130
128
GROUP
FINANCIAL
REVIEW
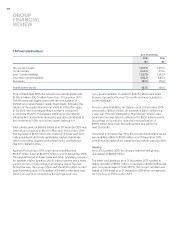
1.5 Financial Position
As at 31 December
2015 2014
$m $m
Non-current assets 1,305.6 1,315.6
Current assets 603.8 671.6
Less: Current liabilities 1,027.9
Less: Non-current liabilities 693.9 1,192.9
Net assets 187.6 645.3
149.0
Shareholders’ equity 187.6 149.0
As at 31 December 2015, the Group’s non-current assets was non-current liabilities. In addition, $137.5 million bank loans
$1,305.6 million, $10.0 million lower than 31 December 2014. became due within the next 12 months and was included in
The decrease was largely due to the de-consolidation of current liabilities.
SSAPL’s non-current assets, mainly fixed assets, following the
dilution of the equity interest from 100% to 30% at fair value For non-current liabilities, the balance as at 31 December 2015
in 3Q-2015, with a corresponding increase in investment amounted to $693.9 million, an increase of $48.6 million from
in associate (SSAPL). Fixed assets additions to the network a year ago. This was attributed to “Borrowings” where a new
infrastructure and systems during the year also contributed to bank term loan was taken to refinance the $200 million current
the movements in this non-current assets balance YoY. borrowings on its maturity date and a reclassification of
$137.5 million bank loans that will become due within the
Total current assets at $603.8 million as at 31 December 2015 was next 12 months.
lower when compared to $671.6 million as at 31 December 2014.
The decrease of $67.8 million was made up of lower cash and Compared to 31 December 2014, the Group’s shareholders’ equity
cash equivalents, and trade receivables, higher inventories, was up $38.6 million to $187.6 million as at 31 December 2015,
other receivables, deposits and prepayments, and balances contributed by higher share capital and increased retained profits.
due from related parties.
Gearing
Against 31 December 2014, total current liabilities was As at 31 December 2015, the Group’s total borrowings were
$165.0 million lower at $1,027.9 million as at 31 December 2015. maintained at $687.5 million.
This was attributed to lower trade and other payables, provision
for taxation, higher balances due to related parties and a lower The lower cash balances as at 31 December 2015 resulted in
current portion of borrowings that became due in the year. higher net debt of $514.1 million, compared to $423.3 million last
During the year, the Group refinanced the $200 million current year. As a percentage of 2014 EBITDA, the Group’s net debt was
bank borrowing as at 31 December 2014 with a new term loan, higher at 0.69 times as at 31 December 2015 when compared to
which has now been included as Borrowings under the 0.57 times as at 31 December 2014.