
Page 88 - index
P. 88
86
SUSTAINABILITY
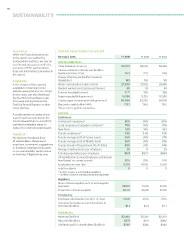
Assurance StarHub Value Creation Scorecard FY 2015 FY 2014 FY 2013
While the financial statements Strategic Area 56,706 54,624 58,383
in the report are audited by
independent auditors, we rely on ENVIRONMENTAL 23.2 22.9 24.8
our internal process to verify the CO2e emissions (tonnes)
accuracy of ESG performance Carbon emission intensity per $million 183 183 181
data and information presented in revenue (tonnes CO2e) 27,500 27,832 29,348
the report. Energy intensity per $million revenue
(Gigajoules) 30 33 49
Availability Water consumption (cubic metres) 117* 385 259
General waste (non-hazardous) (tonnes) 19,295 12,210 10,260
A PDF version of the report is E-waste recycled (tonnes) 40,065 53,230 59,635
available for download at our Paper recycled (kilogrammes) 121.7 118.8 115.2
website www.starhub.com. Smart Copier paper consumption (kilogrammes)
device users can also download Electricity used (million kWh) 88% 88% 80%
the StarHub Annual Report app 75% 76% 81%
to browse and experience the * Please refer to pg 98 for explanation. 320 346 464
StarHub Annual Reports on their 43% 43% 42%
smart devices. SOCIAL 36% 35% 37%
Employees 38% 38% 38%
A small number of copies of this Permanent employees+ 33% 33% 34%
report have been printed on the Local employees (Singapore citizens)++
Forest Stewardship Council (FSC) New hires 20 17 25
certified sustainable paper to Female employees++ $611 $873 $884
reduce the environmental impact. Female managers (% of Senior level)
Female managers (% of Middle level) 92% 92% 97%
Feedback Female Heads of Department (% of HODs) 12.0% 14.0% 15.5%
Average training hours per employee
We welcome feedback from Training expenditure per employee 0 0 0
all stakeholders. Please send HR Satisfaction Survey (Employee satisfaction
questions, comments, suggestions level based on survey scores) 89.0% 91.0% 87.0%
or feedback relating to this report Employee turnover rate 82.7% 86.4% 87.0%
or our sustainability performance Fatal Accidents
to StarHubCSR@StarHub.com 144.0 213.5 211.5
+ % refers to base of total StarHub workforce
++ % refers to base of StarHub permanent employees $1.1 $1.4 $1.2
Suppliers $2,444 $2,387 $2,370
Share of local suppliers as % of total supplier $372 $371 $380
payments $346 $345 $344
Proportion of local suppliers
Community
Employee volunteerism (number of days)
Community investment and donations to
charities ($million)
FINANCIAL
Revenue ($million)
Net profit ($million)
Dividends paid to shareholders ($million)